

Saudi-Egypt trade exchange hits SAR 444B in 10 years

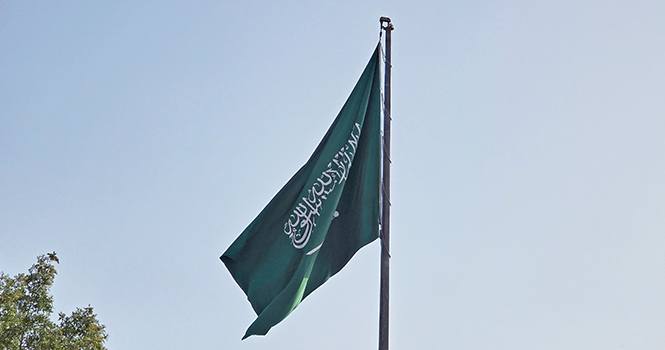
The Kingdom of Saudi Arabia's flag
Saudi Arabia and Egypt have maintained strong economic and trade relations spanning decades, covering a wide range of areas, foremost among them trade, investment, energy, and services. Bilateral trade is one of the most prominent aspects of these relations, with a diverse range of traded goods, varying trade volumes from year to year, and a trade surplus in favor of the Kingdom over the past decade.
In the occasion of Crown Prince Mohammed bin Salman’s visit to Cairo, Argaam highlights developments in the Saudi-Egypt trade ties over the past 10 years, emphasizing the size of trade and the key goods traded between the two countries.
From 2016 to 2025, total bilateral trade exceeded SAR 443.7 billion, comprising approximately SAR 287.1 billion in Saudi exports to Egypt and SAR 156.7 billion in Saudi imports from Egypt, resulting in a trade surplus of around SAR 130.4 billion in favor of the Kingdom.
Total trade exchange skyrocketed 213% from SAR 21.72 billion in 2016 to SAR 67.93 billion in 2025. The highest level during the period was recorded in 2022, at SAR 76.54 billion.
|
Saudi-Egypt Trade Exchange During 2016–2025 (SAR bln) |
||||
|
Year |
Saudi Exports to Egypt |
Saudi Imports from Egypt |
Trade Surplus |
Trade Exchange |
|
2016 |
13.79 |
7.93 |
5.86 |
21.72 |
|
2017 |
15.13 |
8.49 |
6.64 |
23.62 |
|
2018 |
19.36 |
5.64 |
13.72 |
25.00 |
|
2019 |
25.79 |
10.30 |
15.49 |
36.09 |
|
2020 |
18.90 |
10.13 |
8.77 |
29.03 |
|
2021 |
38.71 |
15.78 |
22.93 |
54.49 |
|
2022 |
51.71 |
24.83 |
26.88 |
76.54 |
|
2023 |
28.24 |
19.76 |
8.48 |
48.00 |
|
2024 |
32.28 |
29.02 |
3.26 |
61.30 |
|
2025 |
43.14 |
24.79 |
18.35 |
67.93 |
|
Total |
287.05 |
156.67 |
130.38 |
443.72 |
Key Saudi Exports to Egypt in 2025
Saudi exports to Egypt were primarily concentrated in mineral products, which accounted for more than 75% of the 2025 total. These were followed by plastics, rubber and articles thereof; chemical products; metals and articles thereof; and transport equipment.
|
Key Saudi Exports to Egypt in 2025 |
||
|
Category |
Value (SAR bln) |
% to Total |
|
Mineral products |
32.52 |
75.40% |
|
Plastics, rubber and articles thereof |
5.14 |
11.91% |
|
Chemical products |
1.82 |
4.22% |
|
Metals and articles thereof |
1.32 |
3.06% |
|
Transport equipment |
0.67 |
1.56% |
|
Paper and articles thereof |
0.43 |
0.99% |
|
Electrical machinery and equipment |
0.41 |
0.94% |
|
Live animals and animal products |
0.19 |
0.45% |
|
Vegetable products |
0.18 |
0.41% |
|
Prepared foodstuffs, beverages and tobacco |
0.15 |
0.35% |
|
Other Sectors |
0.31 |
0.72% |
|
Total |
43.14 |
100% |
Key Saudi Imports from Egypt in 2025
Data for 2025 show that Saudi imports from Egypt were primarily concentrated in mineral products, which accounted for around 57% of total imports, with a value exceeding SAR 14 billion. These were followed by metals and articles thereof at 10.7%; prepared foodstuffs, beverages and tobacco at 6.56%; vegetable products at 5.92%; and chemical products at 5.35%.
|
Key Saudi Imports from Egypt in 2025 |
||
|
Category |
Value (SAR bln) |
% to Total |
|
Mineral products |
14.01 |
56.53% |
|
Metals and articles thereof |
2.66 |
10.72% |
|
Prepared foodstuffs, beverages and tobacco |
1.63 |
6.56% |
|
Vegetable products |
1.47 |
5.92% |
|
Chemical products |
1.33 |
5.35% |
|
Electrical machinery and equipment |
0.99 |
4.00% |
|
Textiles and articles thereof |
0.50 |
2.02% |
|
Miscellaneous manufactured goods |
0.41 |
1.67% |
|
Live animals and animal products |
0.34 |
1.38% |
|
Transport equipment |
0.31 |
1.27% |
|
Other Sectors |
1.14 |
4.59% |
|
Total |
24.79 |
100% |

About Us
Join Us

Comments {{getCommentCount()}}
Be the first to comment
رد{{comment.DisplayName}} على {{getCommenterName(comment.ParentThreadID)}}
{{comment.DisplayName}}
{{comment.ElapsedTime}}